What Would a Perfect London Look Like?
“Happiness depends upon ourselves.” ~ Aristotle
It’s a cold Monday morning, mid-January. The tube is late and the person standing next to you on the platform is playing music aloud from his phone. You want tell him to stop but you won’t. That’s not the London way.
Happiness is rarely something associated with big urban cities. It’s something generally associated with a weekend away in the country or that trip to Malaga with your friends. You know the one. Increasingly Londoners seem to be more and more unhappy. So if it’s such an unhappy place, why do people keep moving here?
Well, business in London accounts for 22% of the UK Gross Domestic Product (GDP). With London seen as the primary business hub for the UK, the choice becomes not, ‘would it be a good idea for me to move to London’ but ‘when do I move?’. The lack of alternatives weighs heavily on the happiness of Londoners.
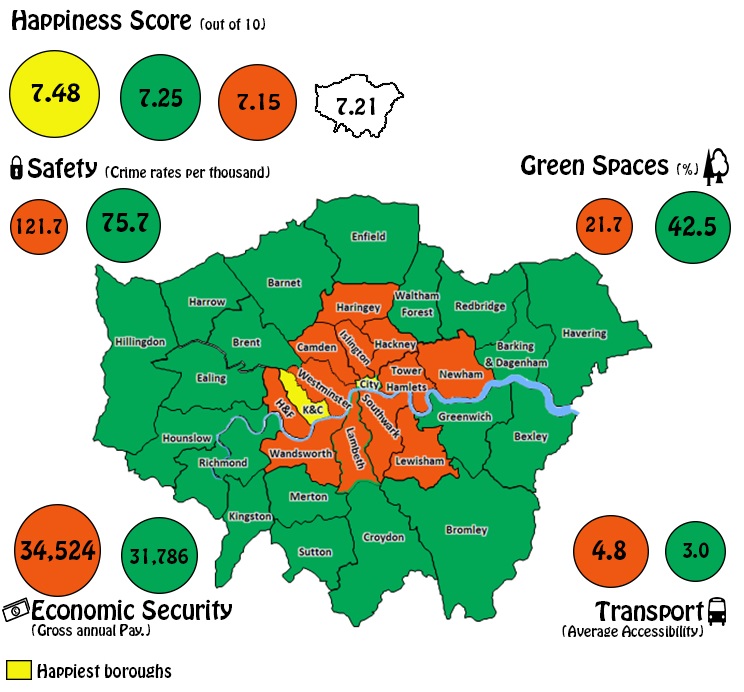
In an October 2013 government report, Londoners interviewed about their happiness gave an average score of 7.21 out of 10. The national average is 7.28. How could this be?
Well, there are a number of different theories, but they boil down to 4 main categories (hereby known as ‘Happiness Categories’) that seem to make people happier. They are as follows:Safety, Green Spaces, Economic Security and Public Transport. The big four.
In analysing the data, it can be seen that residents of London’s largely business oriented Inner London have an average happiness score of 7.15, whereas residents of the relatively leafier and more suburban Outer London have an average happiness score of 7.25 – Why is this?
Outer London seems to be significantly safer, as shown by the crime rate (per 1000 people) being 75.7 against the significantly higher 121.4 in Inner London. Interestingly, there seems to be a link to population density (number of people per hectare). In Inner London the population density is 104.6 compared to Outer London’s 40.7.
As far as the other ‘Happiness Categories’ go, Outer London continues to rank highly. It has a significantly higher percentage of open green spaces,42.5% to Inner London’s 21%.
It also goes to show that while the average income in Inner London is greater (£35,307) than that of Outer London (£31,900), the average 2013 house prices showed that residents of Outer London are in fact more economically secure as they are making their money go further. This can be seen by people in Outer London paying 30.6% less than Inner Londoners for the same size property.
Outer London can also be seen to have far more Income Equality than Inner London with the difference between the highest and lowest average borough earnings being £10,886 (between Richmond and Waltham Forest) compared with £17,342 (between Kensington & Chelsea and Newham).
Outer London does, it seems, overwhelmingly portray the characteristics required for a happy London. However, it is important to point out that the two happiest boroughs in London (Kensington & Chelsea – 7.51 and City of London – 7.44) buck the trend and are both located in Inner London.When running down the list of ‘Happiness Categories’, it can be seen that these two boroughs do actually score rather highly.
As far as economic security goes, they are the two highest earning areas of London, with average yearly earnings of £45,625 (based only on Kensington and Chelsea – no financial data is available on the City of London, but it is generally accepted to be similar to that of Kensington and Chelsea).
Both the City of London (7.6) and Kensington and Chelsea (5.8) score in the top 3 of the 2012 Public Transport Accessibility Score (sandwiching Westminster with 6.3).
As far as green spaces go, some of the most pleasant London Parks are located in Kensington & Chelsea (Green Park, Hyde Park, Kensington Gardens and Holland Park). In addition to this, the famed Royal Albert Hall can be found in Kensington as well of a number of other well known cultural establishments.
The negative to say about this area seems to be that its population density and crime rates are both rather high at 78 and 98.6 (per 1000 people) respectively. It does seem however, that with the quality of housing and the multiple positive attractions to this borough that these pitfalls are overlooked.
After reading that, you may well be thinking, ‘So – money is the key to happiness?’. You could be forgiven for thinking that, but the issue is in fact more complex than that. Take Westminster, for instance.
Westminster has, at 282 per 1000 people, nearly double the crimes committed of the next worst borough in London. It also has the third highest average pay in London £39,116 and one of the lowest happiness scores, 7.09 – significantly lower than both the Inner London and UK averages.
So no, money does not necessarily buy you happiness. Enfield, in Outer London has one of the lowest average incomes (£29,629) but has a very high happiness score of 7.41. This could largely be to do with the low crime rates (71.7 – less than the average) low population density (39.9) and large percentage of green outdoor spaces (45.6%). The average house prices in Enfield are also lower that the average Outer London prices (£250,000).
With a risk of resorting to lazy clichés, the data in this article shows two things. Firstly – money doesn’t necessarily buy you happiness, and secondly, happiness seems to grow on trees!
Cities in the future are going to become more crowded, the job market will become busier, things will get more expensive and life will become harder. London city planners are going to have to find a way to keep their populations happy.
From what we have seen, the perfect London will have to change in several distinct ways.
- Public Transport will have to improve.
- There must be fewer cars on the roads.
- We must encourage the growth of large, green outdoor spaces.
- We must make our buildings more attractive to look at.
- London will have to expand outwards (as long as it doesn’t become the next Los Angeles!). Overcrowding only leads to increases in crime and decreases in happiness.
- We must ensure that all of London is wonderful not just the wealthy areas! In order for a city to genuinely move forward, efforts must be made to stop income inequality – if not on an individual level then at the very least on a Borough-wide level.
Thus it can be seen that London changing to make it’s citizens happier in the future is not only a possibility but a necessity. In the short term, it seems that we need to be the key to our own happiness and fully make the most of all the wonderful things that London has to offer!